Budget season for the first quarter of 2027 lands on top of a market that has stopped helping. Global steel demand is flat in 2026 at 1,722 Mt, with only 1.7% growth expected in 2027, and almost the whole of the downgrade belongs to China. Iron ore is trading near 90 USD per tonne. When price cannot carry the margin, the cast house becomes a cost conversation, and the cast house budget becomes a document that has to defend itself.
Most of these budgets are built the lazy way: last year’s consumable spend with an inflation adjustment on top. That number hides everything that matters. It does not say whether the plant drilled more holes, paid more per hole, or bought a worse tool at a better price. A cast house budget built on tap count does.
Build the line on tap count, not on last year’s invoice
The arithmetic starts with how often the furnace is tapped. Multiply taps per day by the number of furnaces by operating days and you have the only volume figure the consumables budget really needs. A two furnace shop tapping eight times a day per furnace, 350 days a year, is running about 5,600 taps. Every consumable line can then be expressed per tap instead of per year, and that is the version that can be compared with another site, another furnace or another supplier.
Then take your own consumption rate: bits per tap, rods per tap, sleeves per thousand taps. Most cast houses know those numbers within ten per cent once somebody counts for a fortnight. Multiply rate by tap count by unit cost and the budget builds itself. Where the answer looks wrong, the fault is usually in the rate, not in the price.
Split the budget into drivers you can actually manage
- Bits: consumption per tap, driven by clay hardness, taphole temperature and wing or button geometry. This is the line most exposed to specification drift – see the four wear parts that decide cast house drilling cost.
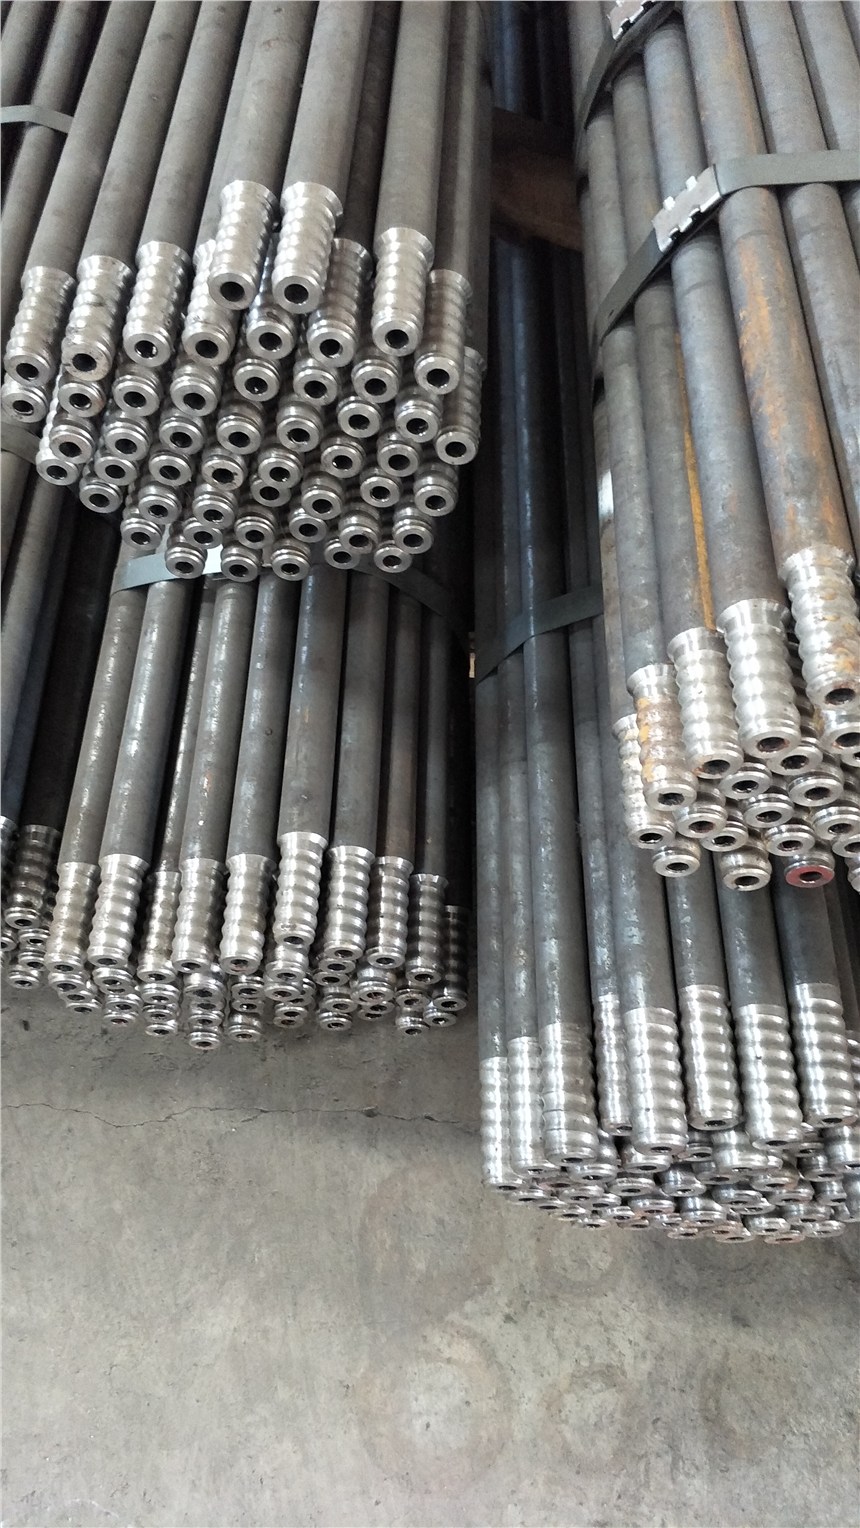
- Rods: wear shows at the thread end and at the shank. A rod that fails early is a bit that never gets used.
- Sleeves, adapters and shanks: the cheapest items in the budget and the most common reason a crew stands still.
- Reconditioning and grinding: cost per re-dressed tool compared with cost per new tool, which is not the same as comparing prices.
- Freight, duty and currency: on flat product, eight per cent of landed cost is the entire negotiation, and the 2026 trade measures made that worse – see what the trade rules mean for plant buyers.
- Buffer stock: the carrying cost of holding six to eight weeks of rods is the cheapest insurance line in the whole document.
Put the 2027 calendar inside the plan
Chinese New Year falls on Saturday 6 February 2027, eleven days earlier than in 2026. That is not just a holiday date. Chinese factories typically start winding down two to four weeks before the new year, the official public holiday runs through the first half of February, and production returns progressively through late February and March rather than at full capacity on the first working day. Freight space tightens and rates climb in the run-up as everyone tries to ship before the break.
The practical consequence for a Q1 budget is that an order intended to be on the rack before the holiday needs to be placed in late November, not January. If part of the Q1 programme comes from Chinese supply, and for many cast houses it does, then the purchase order date is a budget line and not an administrative detail. Lead time is a cost, and the first quarter of 2027 concentrates it.
Three numbers that belong in the budget notes
- Cost per hole: the only figure that compares fairly between suppliers, and the one that converts a price argument into an engineering one. The method is set out in consumable volume arithmetic for a cast house.
- Days of cover: stock on hand divided by daily consumption. Anything below four weeks going into February is an exposure, and two weeks is a gamble.
- Minutes per taphole: the crew time a tool consumes. A bit that saves eight per cent on price and adds two minutes to every tap has cost the plant money.
A structure you can copy
- Line 1: annual tap count, by furnace, with the days lost to relines and planned stops already deducted.
- Line 2: consumption per tap for each item – bits, rods, sleeves, adapters – based on measured rate, not on catalogue claims.
- Line 3: unit cost by specification, so that R32 left-hand connections, diameters and carbide grades are priced separately rather than averaged.
- Line 4: landed cost adder for freight, duty and exchange rate, kept visible instead of folded into unit price.
- Line 5: buffer stock target and its carrying cost, expressed in days of cover.
- Line 6: contingency of five to eight per cent, and a quarterly review date with a named owner.
What would change the plan mid-quarter
- Demand quietly improving: demand outside China grows 1.5% in 2026 and is forecast to accelerate to 4.0% in 2027, with India expected to consume 172.4 Mt in 2026 and 186.2 Mt in 2027.
- Europe restocking: EU apparent steel use is forecast to fall 0.3% in 2026 and rebound 3.1% in 2027. A restocking quarter changes how urgent maintenance becomes.
- Quota exhaustion: with the EU tariff-free import volume cut to 18.3 Mt a year and divided by quarter, a single product category can fill up inside a month.
- Reline decisions: choosing to extend a campaign rather than rebuild one moves consumable demand forward by quarters, as covered in blast furnace life extension economics.
- Ore and margin: iron ore near 90 USD per tonne keeps the cost floor low. A sustained rally would squeeze exactly the maintenance budget this exercise is protecting.
None of this requires a new system. It requires the budget to be built from holes rather than invoices, to have the February closure already in the calendar, and to keep three measured numbers visible all year: cost per hole, days of cover and minutes per taphole. The market backdrop those numbers sit inside is set out in our Q4 2026 steel market analysis, and the ordering side of it in consumable planning around a reline.